Revenue Reports Option "B"
Note: Any contracts that were closed and re-opened in this report will throw off BOR counts.
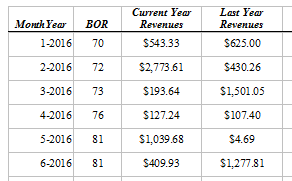
The rows in the Management Tracking Report are described below.
MonthYear: The month and year for the rows data.
BOR: BOR count at the end of that month.
Current Year Revenues and Last Year Revenues: Includes all income, rental and retail, does not include Sales Tax.
In the screen shot below for 1-2016 Current year revenue you would be for 1/1/2016 to 1/31/2016
In the screen shot below for 1-2016 Last year revenue you would be for 1/1/2015 to 1/31/2015
For the current month the revenue for current and last year is Month to Date only.
New Rentals, ReRentals and Pickups: The number of BOR rented and picked up for this month. A ReRental is when a previously rented item is rented out.
Payouts: Customers that paid to full term. Does not include early payouts.
Early Payouts: BOR count for contracts that Paid Out Early.
Early Payout $$$: Of the contracts above, this is the total of their last payment. In other words, their Final Payment. This is total collected - tax. This does not include transactions that were refunded, even if they were refunded outside of this period. For instance if a contract was closed as EPO on 1/31 and then refunded on 2/1, a revenue report would show the EPO revenue on 1/31 and show it subtracted on 2/1, this report would not show that EPO revenue at all.
Payouts No Open: Customers that paid out and currently do not have an open agreement.
Payouts<120: This is customers that paid out in less than 120 days.
Payouts<210: This is customers that paid out in less than 210 days.
Skips: Skip and charge off BOR count for the time period.
Repos: BOR count for customers repossessed.
Custs. Renting: Number of customers that have opened an agreement in that month.
Return PaidOuts: Customers who opened a new agreement who have previously paid out agreement(s).
New Cust: Of the customers renting how many are brand new customers.
Bottom section of Report
Free Money: Money "lost" from moving due dates YTD. Percent is Free Money divided by YTD total Current Year Revenues.
Free Weeks: Total days due dates moved divided by 7.
Skip Rate: Number of (Skips) divided by (New Rentals + Rerentals) using YTD totals.
Keep Rate: Number of (Early Payouts + Payouts) divided by (New Rentals + Rerentals) YTD totals.
Conservation Rate: Returning Payouts divided by Customers renting using YTD totals.
Retention Rate: (New rentals + Rerentals) minus (Pickups + Skips) divided by (New Rentals + Rerentals) using YTD totals.
MTD numbers for Skip, Keep, Free Money, Conservation, Retention, Free Money percent use the same calculations but only for the current month.
MTD Free Money Paid outs: Dollar amount of deferrals (due date moves) given to Paid out customers.
MTD Free Money All Others: Dollar amount of deferrals (due date moves) given to everyone that is not a Paid out customer.
Lost Rev. Summary: Of the YTD Free money above, how much was for Paid outs and how much was for everyone except paid outs.
Uncollected Revenues: Back rent due from closed agreements from customers that still have active agreement(s).
% New Inv: Qty: In Stock inventory the % that is new by count.
% New Inv. Cost: In Stock inventory the % that is new calculated by cost.
Projected APU: Average APU of each BOR inventory item. This is the total monthly rental amounts on open agreements divided by BOR count.
Account Breakdown: Term Breakdown of open contracts R, L, G, O types ONLY*.
Contracts Deferred 7+ days in the last 12 months: This is the count of how many times due dates were moved or deferred 7 days or greater in the last twelve months subtotalled by their current contract status.
Units: Total number of BOR inventory. Non BOR is not counted. Includes Rented, Leased, Loan, Stock, Service.
% Idle Inv: Total BOR inventory that is in stock divided by total inventory.
Inventory $: Total cost of Units that fit the following parameters status = 'STOCK', 'LEASED', 'RENTED', 'RENT TO RENT' or 'LOANER' and BOR = 'YES'.
Avg. Unit Cost: Inventory $ divided by Units
Avg. Unit Age: Avg difference of received date to current date.
Avg Contract Terms: Broken down by Open, Closed, Paid out and Total in weeks.
Average contract terms is the number of days between the contract date and the last transaction date divided by 7, For closed contracts the last transaction date would be the date it was closed.
GRP Collected: Damage waiver collected YTD.
GRP Write Offs: Dollar amount we wrote off when a customer used Damage Waiver YTD.
Contracts with GRP: Total number of agreements that have Damage Waiver, R, L, G, O types ONLY*.
GRP %: Percentage of agreements with Damage Waiver, R, L, G, O types ONLY*.
Total Contracts: Total Agreements open R, L, G, O types ONLY*.
*Contracts types definition. R = Rent to Own. L = Lease to Own. G = As Agent. O = Other. Cash Advance, Open Sale, Loaners and NSF's are not included in any of the contract counts on this report.