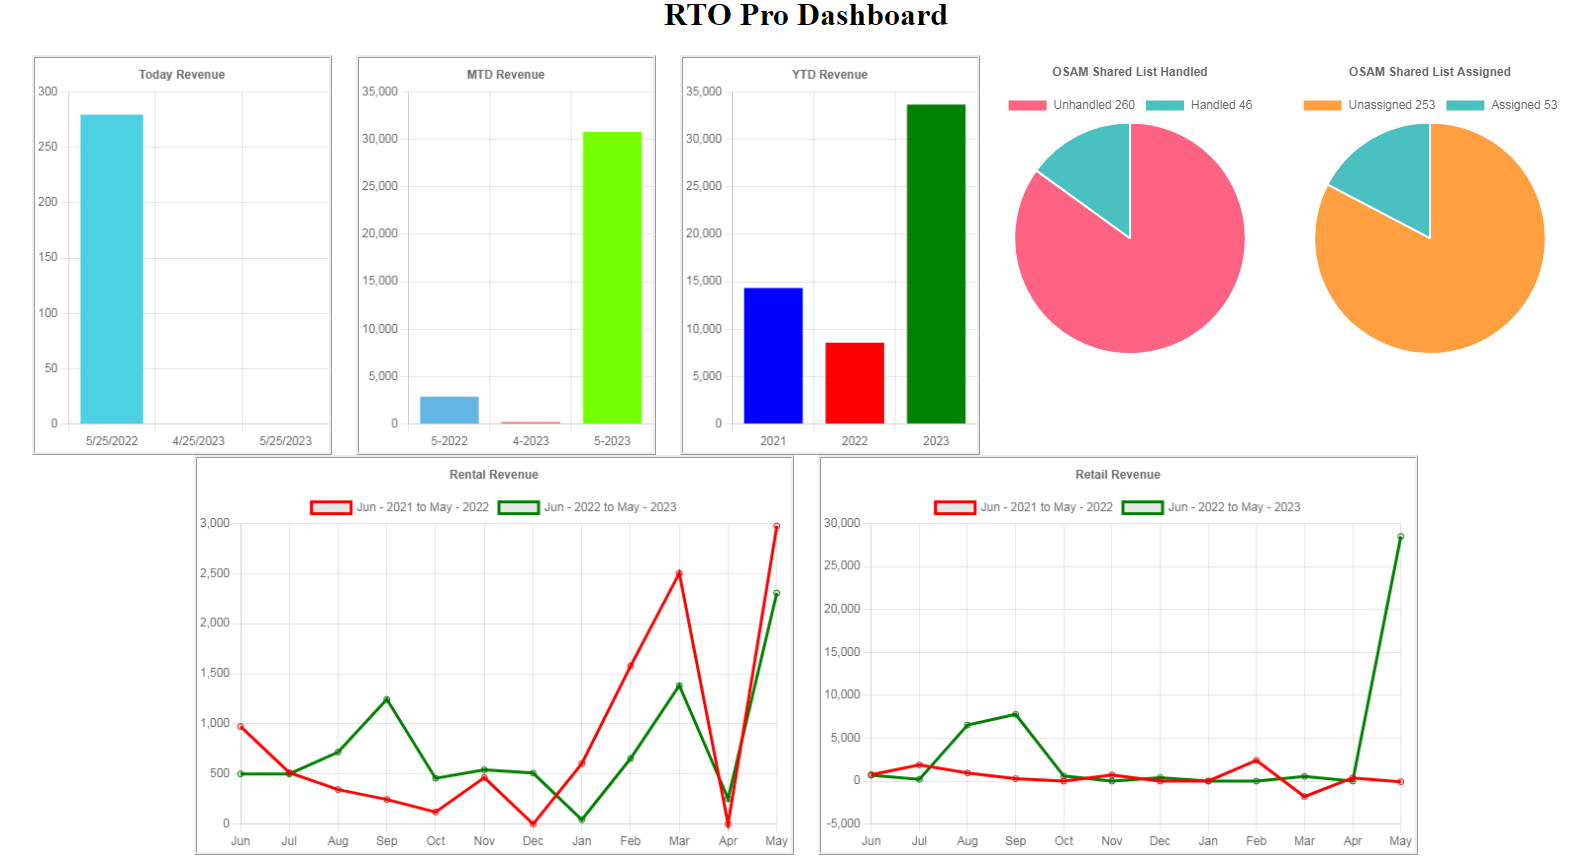
The RTO Pro Dashboard can be displayed from Revenue Reports menu option I.
At the bottom is a screen shot of a sample dashboard, each graph will be explained below.
Today Revenue: This is total revenue for today vs this date last month and last year.
MTD Revenue: This is total revenue month to date vs MTD last month and MTD this month last year.this date last month and last year.
YTD Revenue: This is total revenue for year to date vs YTD last year and the year before.
This OSAM Shared List graphs will only display if you use the OSAM shared list feature and a shared list was created for today.
OSAM Shared List Handled: This is the total customer and handled customers in the list. Handled is when an account manager flags an overdue customer as handled, like they got a commitment, or did everything they can do for the day for that customer.
OSAM Shared List Assigned: This is the total customer and assigned customers in the list, assigned just means an account manager has displayed this customer on their screen.
Rental Revenue: This is a comparison between the last 12 months and the 12 months before that, rental revenue only.
Retail Revenue: This is a comparison between the last 12 months and the 12 months before that, retail revenue only.
Click here to see where these figures come from and a note for Bonus Bucks users (Below Dashboard screen shot)
Where the graph revenue figures come from and a note for Bonus Bucks users
To see where the figures come from used in the graph see the screen shot below from a Payment/Transaction Report.
Rental Income on graph: #2 in the image below minus #1 (Total Rental - Rental tax)
Retail Income on graph: #4 in the image below minus #3 (Total Retail - Retail tax)
Total Income on graph: #6 in the image below minus #5 (Total Revenue - Total tax)
Bonus Bucks users see below the screen shot for more info.
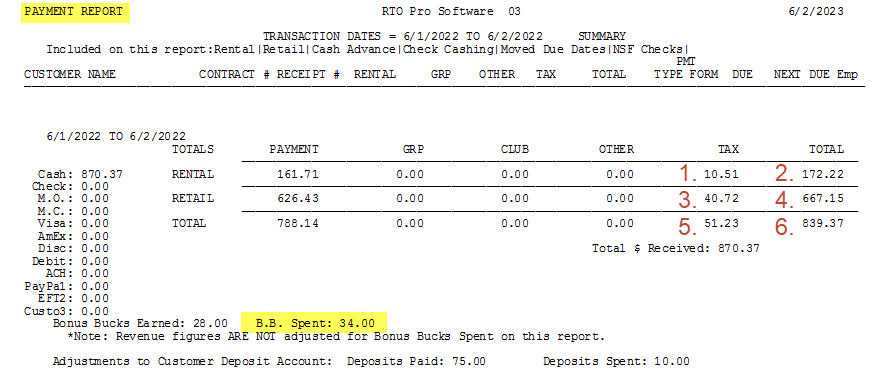
Bonus Bucks Users
Below is an explanation of how the rental and retail income is calculated for the graphs if you use Bonus Bucks.
Rental Income on graph: #2 in the image below minus #1, minus BB Spent (Total Rental - (Rental tax + BB Spent))
Retail Income on graph: #4 in the image below minus #3 (Total Retail - Retail tax)
Total Income on graph: #6 in the image below minus #5, minus BB Spent (Total Revenue - (Total tax + BB Spent))
If you use Bonus Bucks these figures are not 100% accurate for revenue figures and should not be used for accounting purposes. Calculating revenue when you use Bonus Bucks requires adjustments to all revenue fields and tax, this report does not make those adjustments individually and instead removes all bonus bucks spent from revenue,, none from tax. The Dashboard graphs should only be used as a comparison tool, not accounting purposes.